This page will be updated weekly with new information on COVID-19
COVID-19 SUMMARY
You can also find this page via tabs at the top of the homepage
This page will be updated weekly with new information on COVID-19
COVID-19 SUMMARY
You can also find this page via tabs at the top of the homepage
There’s so much information about the novel coronavirus COVID-19 on the internet that it is hard to keep up with the onslaught of information. We wanted to compile the ultimate list of reputable resources for clinical providers to access when they need to, at a moment’s time.
Since information on COVID-19 is rapidly changing, these resources are not specific papers or blog posts, but rather websites that are maintaining up to date information on epidemiology, pathophysiology, and management. Resources span all types, including website behemoths like the WHO and CDC, as well as twitter accounts for people who get their news from social media.
Since this is an ultimate list but we don’t pretend to have ultimate knowledge of all resources, please send us resources that we may have missed and we will add them on here! We also acknowledge that this list is U.S. centric because we are from the States, but we would love input on resources for other countries so we can make this a more international list.
Graphics Reuters – for the graphic enthusiasts out there
New York Times Coronavirus Maps – for the graphic enthusiasts out there
That’s it for now! Let us know if we missed any great resources!
Thank you for all the work that all of you do. Stay safe!
This list was compiled by Milana Bogorodskaya, Fatima Al-Dhaheri, and Ahmed Abdul Azim.
Learning about fungi is hard enough even for infectious disease fellows (Narrator: especially for infectious disease fellows). By the time you learn how to differentiate the yeasts from the molds, the fungi kingdom decides to throw you a curve ball: Enter the shape shifters into the game of fungi learning – the dimorphic fungi.
The Dimorphic fungi shape shift depending on the weather (literally). They exist as molds in the great outdoors (environmental temperatures) and yeasts in the great indoors (inside our bodies at body temperatures). Clinically, this also means you will see the yeast forms in a histopathology review of a tissue sample, and our friends in the microbiology lab can re-create the environmental factors to grow them out as mold forms in culture. So essentially, they also shape shift between the microbiology lab and the pathology department. (They are sneaky Fung(uy)i…)
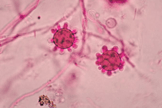
This is the first post out of 6 and will focus on our first shapeshifter, Histoplasma capsulatum.
CLICK HERE for a 2-page PDF handout of this information.

1. Culture:
2. Histopathology:
3. Antigen detection:
4. Serology:
5. Molecular methods:
| Clinical presentation | Mild/Moderate | Moderate/Severe | Chronic |
| Pulmonary | <4weeks: none >4weeks: itraconazole for 6-12 months | Lipid amphotericin B for 1-2 weeks followed by itraconazole for 12 weeks | Itraconazole for 12 months |
| Disseminated | Itraconazole for 12 months | Lipid amphotericin B for 1-2 weeks followed by itraconazole for 12 months | N/A |
References:
1. Climate change: the role of the infectious disease community. Lancet Infect Dis. 2017; 17:1219.
2. Greer A, Ng V, and Fisman D. Climate change and infectious diseases in North America: the road ahead. CMAJ. 2008; 178:715–722.
3. Walsh, TJ, Hayden, RT, and Larone, DH. Larone’s medically important fungi, 6th edition, ASM press, 2018.
4. Queiroz-Telles F, Fahal AH, Falci DR, et al. Neglected endemic mycoses. Lancet Infect Dis. 2017;17:e367–e377.
5. Azar MM and Hage CA. Laboratory Diagnostics for Histoplasmosis. J Clin Microbiol. 2017; 55:1612–1620.
6. Hage CA, Azar MM, Bahr N, Loyd J, and Wheat LJ. Histoplasmosis: up-to-date evidence-based approach to diagnosis and management. Semin Respir Crit Care Med. 2015; 36:729–745.
7. Kauffman CA. Histoplasmosis: a clinical and laboratory update. Clin Microbiol Rev. 2007;20:115–132.
8. Hage CA, Ribes JA, Wengenack NL, et al. A multicenter evaluation of tests for diagnosis of histoplasmosis. Clin Infect Dis. 2011;53:448–454.
9. Wheat LJ and Kauffman CA. Histoplasmosis. Infect Dis Clin North Am. 2003;17:1–19.
10. Swartzentruber S, Rhodes L, Kurkjian K, et al. Diagnosis of acute pulmonary histoplasmosis by antigen detection. Clin Infect Dis. 2009; 49:1878–1882.
11. Saccente M and Woods GL. Clinical and laboratory update on blastomycosis. Clin Microbiol Rev. 2010;23:367–381.
12. Wheat LJ, Freifeld AG, Kleiman MB, et al; Infectious Diseases Society of America. Clinical practice guidelines for the management of patients with histoplasmosis: 2007 update by the Infectious Diseases Society of America. Clin Infect Dis. 2007;45:807–825.

Learning about fungi is hard enough even for infectious disease fellows (Narrator: especially for infectious disease fellows). By the time you learn how to differentiate the yeasts from the molds, the fungi kingdom decides to throw you a curve ball: Enter the shape shifters into the game of fungi learning – the dimorphic fungi.
The Dimorphic fungi shape shift depending on the weather (literally). They exist as molds in the great outdoors (environmental temperatures) and yeasts in the great indoors (inside our bodies at body temperatures). Clinically, this also means you will see the yeast forms in a histopathology review of a tissue sample, and our friends in the microbiology lab can re-create the environmental factors to grow them out as mold forms in culture. So essentially, they also shape shift between the microbiology lab and the pathology department. (They are sneaky Fung(uy)i…)
Some of the clinically relevant dimorphic fungi have a predilection for geographical location (endemic mycoses), and therefore are very popular in board exams to the dismay (or joy, after this review series?) of medical trainees.
#ClimateChangeIsReal isn’t just pertinent in the political arena, but also for these endemic fungi. The grave consequences of climate change might change and expand the geographical distribution(1,2) of these fungi and therefore result in more catch-up learning on our end. This is almost akin to learning the constant re-classification and re-naming of the fungi kingdom (thanks, no thanks taxonomists…)
In this review series, I will go over the endemic fungi in a ‘high yield’ approach that will hopefully be pertinent for both shelf exams/boards and clinical practice.
I’ve also purposefully made it a two-pager/per fungi review (or 1 pager if you print it double-sided, #SaveTheTrees). We will be providing PDF links with every Fungi review. This will be an easy reference for a pocketbook, handouts to print to teach your medical students or if you want to flex your knowledge of endemic fungi during rounds (All win-win-win situations!)
The profile of each shape shifter will be released every Friday in the spirit of #FungalFriday. The dimorphic fungi that will be covered during the #ShapeShifterSeries include:
Our First Shape shifter in the series to be released this coming #FungalFriday will be Histoplasmosis, aka the Ohio valley disease/Cave disease. What does Ohio or caves for the matter have to do with this Fungus? Find out more this coming Friday!
Fatima Al Dhaheri, MBBS
The Fung(uy)i squad
References:
1. The Lancet Infectious Diseases. Climate change: the role of the infectious disease community. Lancet Infect Dis. 2017;17:1219.
2. Greer A, Ng V, Fisman D. Climate change and infectious diseases in North America: the road ahead. CMAJ. 2008;178:715–722.

[This post was written by Ahmed Abdul Azim, a senior infectious disease fellow at Beth Israel Deaconess Medical Center]
During the fall and winter season, you are likely to see a few cases of viral meningitis. Even though viral encephalitis is less common, it is important to try to differentiate these clinical entities as a clinician, since they carry different prognoses. (The bulk of this review is adapted from Mandell, Douglas and Bennett’s principles and practice of infectious diseases)1
Before we go any further, let’s briefly review cerebral spinal fluid findings on lumbar puncture for different syndromes:
| WBC(cells/mm3) | Primary cells | Glucose(mg/dL) | Protein(mg/dL) | |
| Viral | 50-1000 | Lymphocytic | >45 | <200 |
| Bacterial | 1000-5000 | Neutrophilic | <40 | 100-500 |
| Mycobacterial | 50-500 | Lymphocytic | <45 | 50-300 |
| Cryptococcal/fungal | 20-500 | Lymphocytic | <40 | >45 |
Important points to consider:
· Bacterial meningitis: 10% of cases have a lymphocyte predominant CSF cell analysis
· WNV encephalitis: over a 1/3 of patients with WNV encephalitis had neutrophil predominant CSF pleocytosis
· Enteroviruses: CSF analysis done early in illness course may yield neutrophil predominant pleocytosis in 2/3 of cases – generally will convert to lymphocytic predominant if repeated in 12-24 hours.
Take home point: always interpret CSF within the clinical context in front of you!
Both syndromes often present with a triad of2:
(1) FEVER
(2) HEADACHE and
(3) ALTERED MENTAL STATUS
However, the trick is to explore the history and signs further. Epidemiological clues include:
Patients with viral encephalitis: tend to have diffuse cerebral cortex involvement with abnormal cerebral function
– Symptoms: altered mental status, motor/sensory deficits, altered behavior and/or personality changes, speech and/or movement disorders
Patients with viral meningitis: DO NOT have diffuse cerebral cortex involvement → cerebral function IS INTACT
– Symptoms: headache, lethargy, neck stiffness/pain
Patients with meningoencephalitis: tend to have a combination of meningitis and encephalitis symptoms
Regardless, if a patient has symptoms and/or signs of meningitis or encephalitis, a lumbar puncture can be helpful.
Overall, most cases of aspectic meningitis syndromes are caused by viruses
1. Enteroviruses (e.g. Coxsackie, echovirus, other non-polio enteroviruses) – by far the most common cause of viral meningitis/aseptic meningitis3
2. Herpes virus simplex viral meningitis – usually caused by HSV-2 >> HSV-18
3. West Nile Virus – more likely to cause an encephalitis syndrome. Yet, may present with aseptic meningitis or asymmetrical flaccid paralysis10
A cause is identified in approximately 36-63% of cases10,11
Causes of encephalitis (Most common to least common in US study of patients that met criteria for encephalitis)12:
*In a study of HIV uninfected patients, viruses caused up to 38% of cases, followed by bacterial pathogens at 33%, Lyme disease at 7%, and fungi at 7%. Syphilis was identified as the culprit in 5% of cases, and mycobacterial infections at 5%, while prion disease was responsible for 3% of cases of encephalitis11
1. HSV encephalitis: most common cause of encephalitis in the US (1/250,000 population annually). HSV-1 accounts for greater than 90% of HSV encephalitis in adults13. Fewer than 6% of CSF PCR cases had a “normal” neurological exam14.
2. West Nile Virus encephalitis: transmitted via a mosquito (vector) bite, currently the most common cause of epidemic viral encephalitis nationally19
So you are the house officer encountering a patient with 1-2 weeks of progressively worsening fevers, headaches and severe behavioral changes or depressed mental status: what do you do next?
As a standard work up for likely encephalitis in the United States, CSF studies should include1:
Imaging in encephalitis: Magnetic resonance imaging (MRI) of the brain is more sensitive than computed tomography (CT)15. Unless contraindicated, all patients with encephalitis should undergo MR imaging.
1. Mandell, Douglas and Bennett’s principles and practice of infectious diseases (8th ed. 2015 / Philadelphia, PA : Elsevier)
2. Whitley RJ, and Gnann JW: Viral encephalitis: familiar infections and emerging pathogens. Lancet 2002; 359: pp. 507-513
3. Connolly KJ, and Hammer SM: The acute aseptic meningitis syndrome. Infect Dis Clin North Am 1990; 4: pp. 599-622
4. Gomez B, Mintegi S, Rubio MC, et al: Clinical and analytical characteristics and short-term evolution of enteroviral meningitis in young infants presenting with fever without source. Pediatr Emerg Care 2012; 28: pp. 518-523
5. Rotbart HA: Diagnosis of enteroviral meningitis with the polymerase chain reaction. J Pediatr 1990; 117: pp. 85-89
6. Sawyer MH, Holland D, and Aintablian N: Diagnosis of enteroviral central nervous system infection by polymerase chain reaction during a large community outbreak. Pediatr Infect Dis J 1994; 13: pp. 177-182
7. Ahmed A, Brito F, Goto C, et al: Clinical utility of polymerase chain reaction for diagnosis of enteroviral meningitis in infancy. J Pediatr 1997; 131: pp. 393-397
8. Shalabi M, and Whitley RJ: Recurrent benign lymphocytic meningitis. Clin Infect Dis 2006; 43: pp. 1194-1197
9. Corey L, and Spear PG: Infections with herpes simplex viruses (2). N Engl J Med 1986; 314: pp. 749-757
10. Kupila L, Vuorinen T, Vainionpaa R, et al: Etiology of aseptic meningitis and encephalitis in an adult population. Neurology 2006; 66: pp. 75-80
11. Tan K, Patel S, Gandhi N, et al: Burden of neuroinfectious diseases on the neurology service in a tertiary care center. Neurology 2008; 71: pp. 1160-1166
12. Glaser CA, Gilliam S, Schnurr D, et al: In search of encephalitis etiologies: diagnostic challenges in the California Encephalitis Project, 1998-2000. Clin Infect Dis 2003; 36: pp. 731-742
13. Tyler KL: Herpes simplex virus infections of the central nervous system: encephalitis and meningitis, including Mollaret’s. Herpes 2004; 11: pp. 57A-64A
14. Raschilas F, Wolff M, Delatour F, et al: Outcome of and prognostic factors for herpes simplex encephalitis in adult patients: results of a multicenter study. Clin Infect Dis 2002; 35: pp. 254-26
15. Domingues RB, Tsanaclis AM, Pannuti CS, et al: Evaluation of the range of clinical presentations of herpes simplex encephalitis by using polymerase chain reaction assay of cerebrospinal fluid samples. Clin Infect Dis 1997; 25: pp. 86-91
16. Whitley RJ, Alford CA, Hirsch MS, et al: Vidarabine versus acyclovir therapy in herpes simplex encephalitis. N Engl J Med 1986; 314: pp. 144-149
17. Lakeman FD, and Whitley RJ: Diagnosis of herpes simplex encephalitis: application of polymerase chain reaction to cerebrospinal fluid from brain-biopsied patients and correlation with disease. National Institute of Allergy and Infectious Diseases Collaborative Antiviral Study Group. J Infect Dis 1995; 171: pp. 857-86
18. Whitley RJ, Alford CA, Hirsch MS, et al: Factors indicative of outcome in a comparative trial of acyclovir and vidarabine for biopsy-proven herpes simplex encephalitis. Infection 1987; 15: pp. S3-S8
19. Kramer LD, Li J, and Shi PY: West Nile virus. Lancet Neurol 2007; 6: pp. 171-181
20. Watson JT, Pertel PE, Jones RC, et al: Clinical characteristics and functional outcomes of West Nile Fever. Ann Intern Med 2004; 141: pp. 360-365
21. Sejvar JJ, Haddad MB, Tierney BC, et al: Neurologic manifestations and outcome of West Nile virus infection. JAMA 2003; 290: pp. 511-515
22. Jean CM, Honarmand S, Louie JK, et al: Risk factors for West Nile virus neuroinvasive disease, California, 2005. Emerg Infect Dis 2007; 13: pp. 1918-1920
23. Shi PY, and Wong SJ: Serologic diagnosis of West Nile virus infection. Expert Rev Mol Diagn 2003; 3: pp. 733-741
24. Garcia MN, Hause AM, Walker CM, et al: Evaluation of prolonged fatigue post-West Nile virus infection and association of fatigue with elevated antiviral and proinflammatory cytokines. Viral Immunol 2014; 27: pp. 327-333
25. Gilden DH, Mahalingam R, Cohrs RJ, et al: Herpesvirus infections of the nervous system. Nat Clin Pract Neurol 2007; 3: pp. 82-94
When I was an aspiring Infectious Disease fellow, I marveled at how the ID doctors would come up with diseases that no one else had thought of. How did they do that?
They obtain a detailed patient history. (It’s the ID doctors equivalent of a procedure!)
Contact or exposure to certain animals are associated with certain diseases.
These are examples of some of the questions to ask to ascertain whether your patient has been in contact with specific animals:
– Do you have any pets? Do you have frequent contact with anyone else’s pets?
– Do you have contact with any farm or wild animals?
– What do you do for work (farmer, veterinarian, kennel worker, biologists, etc)?
– What do you do for fun (hunting, fishing, cave explorer, raising chickens, etc)?
I’ve created an easy graphic to give you an idea of some diseases that are associated with different animals your patients might encounter. This is to help you quickly look up which infections you should consider in your differential if your patient reports an exposure to one of these animals.

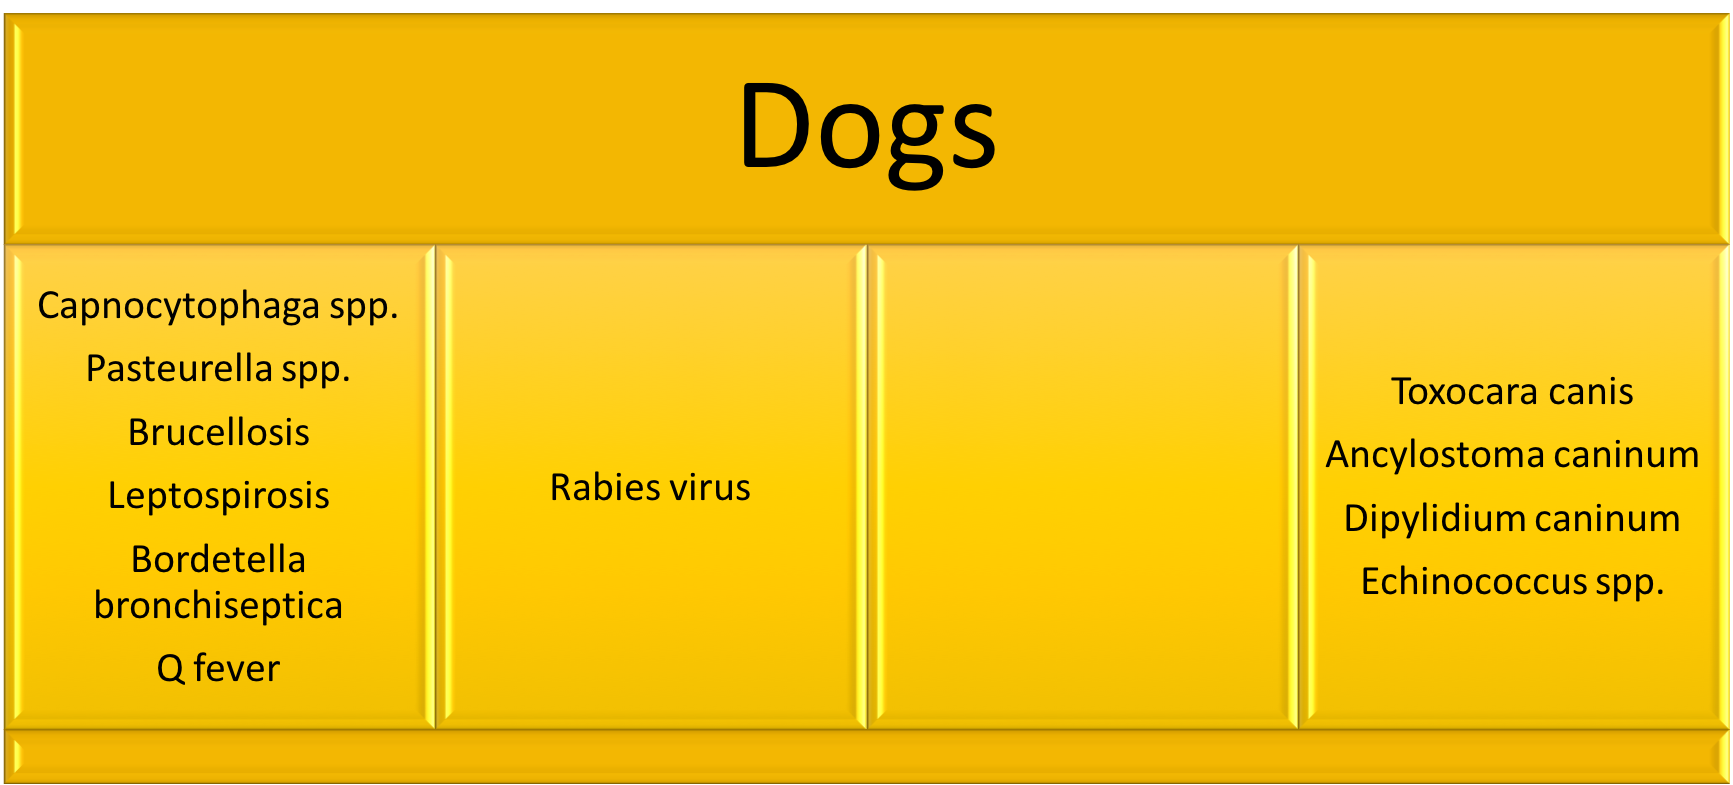

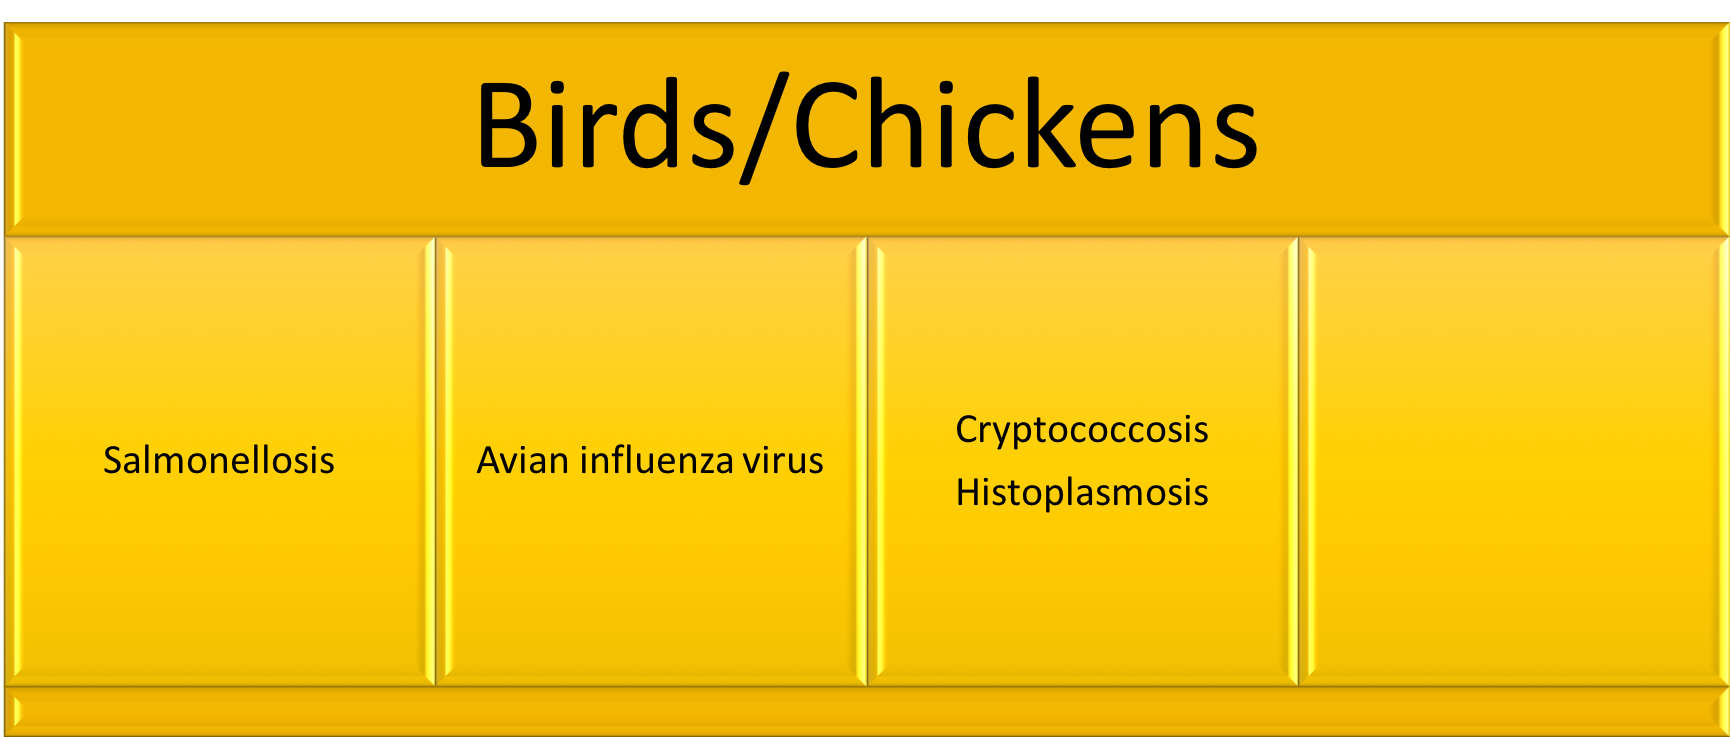

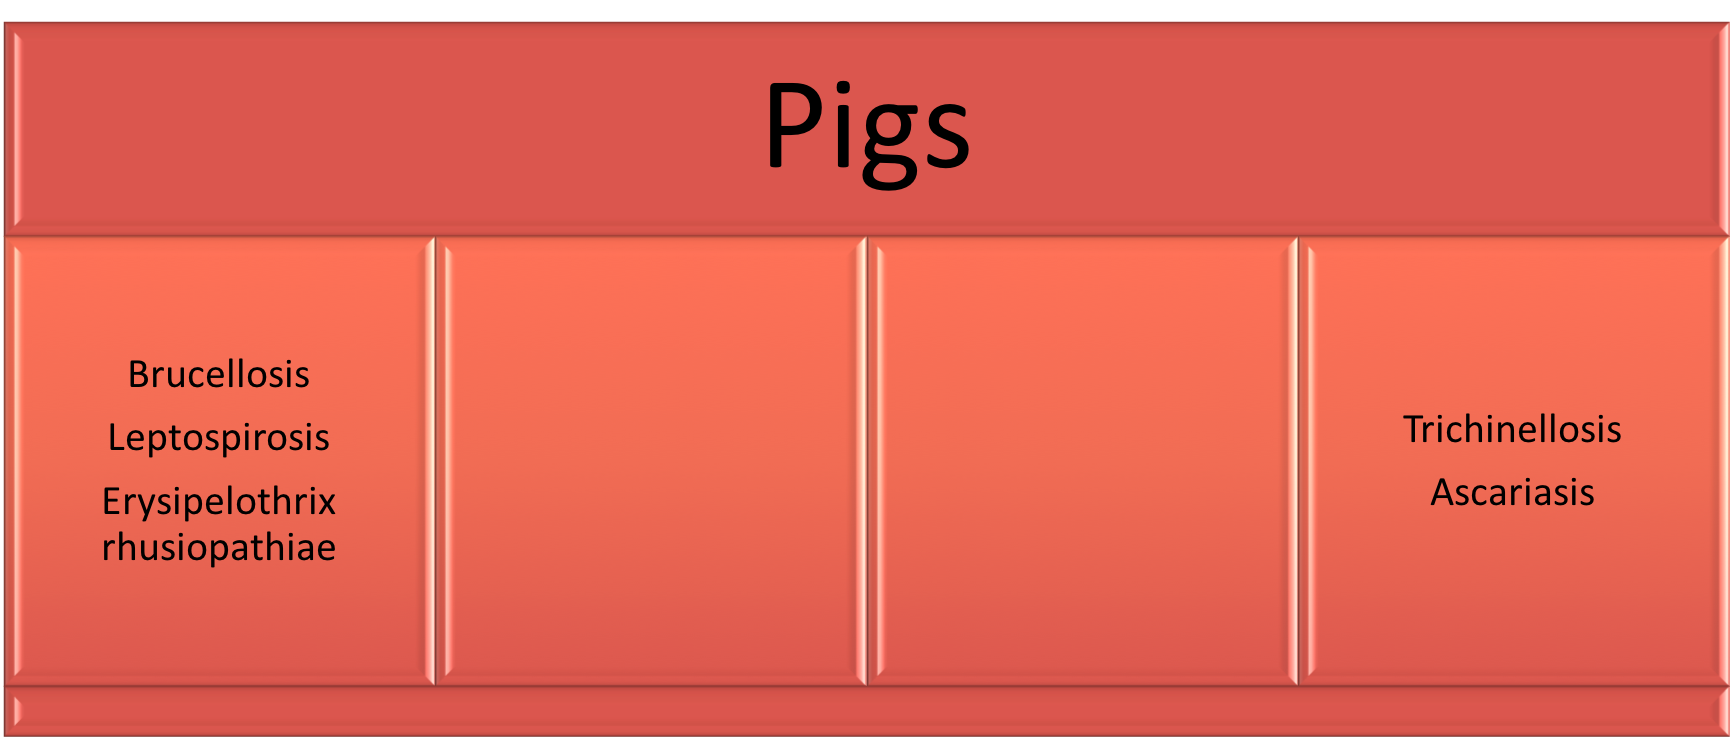
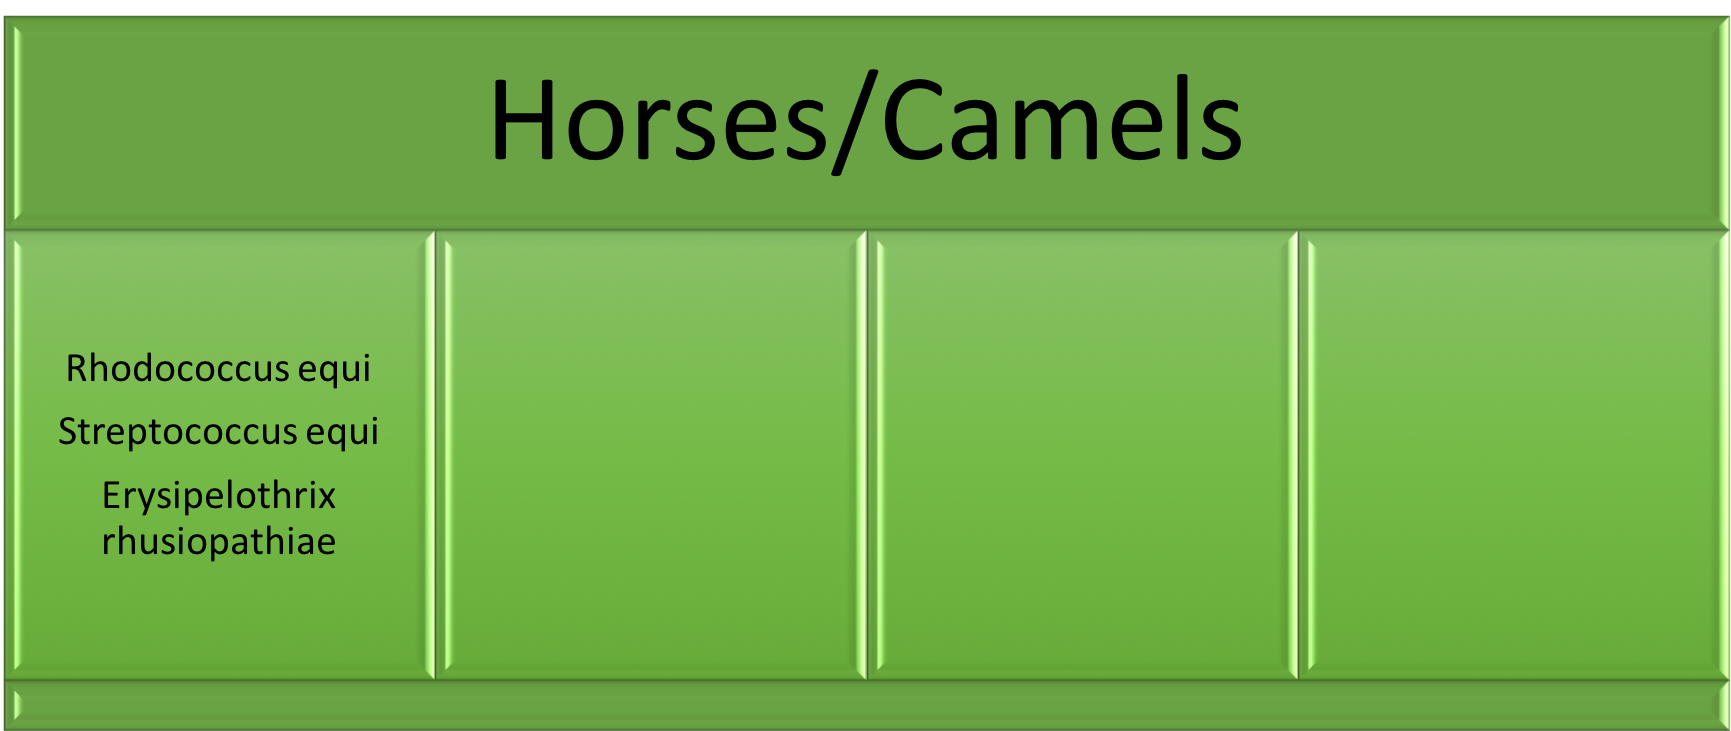
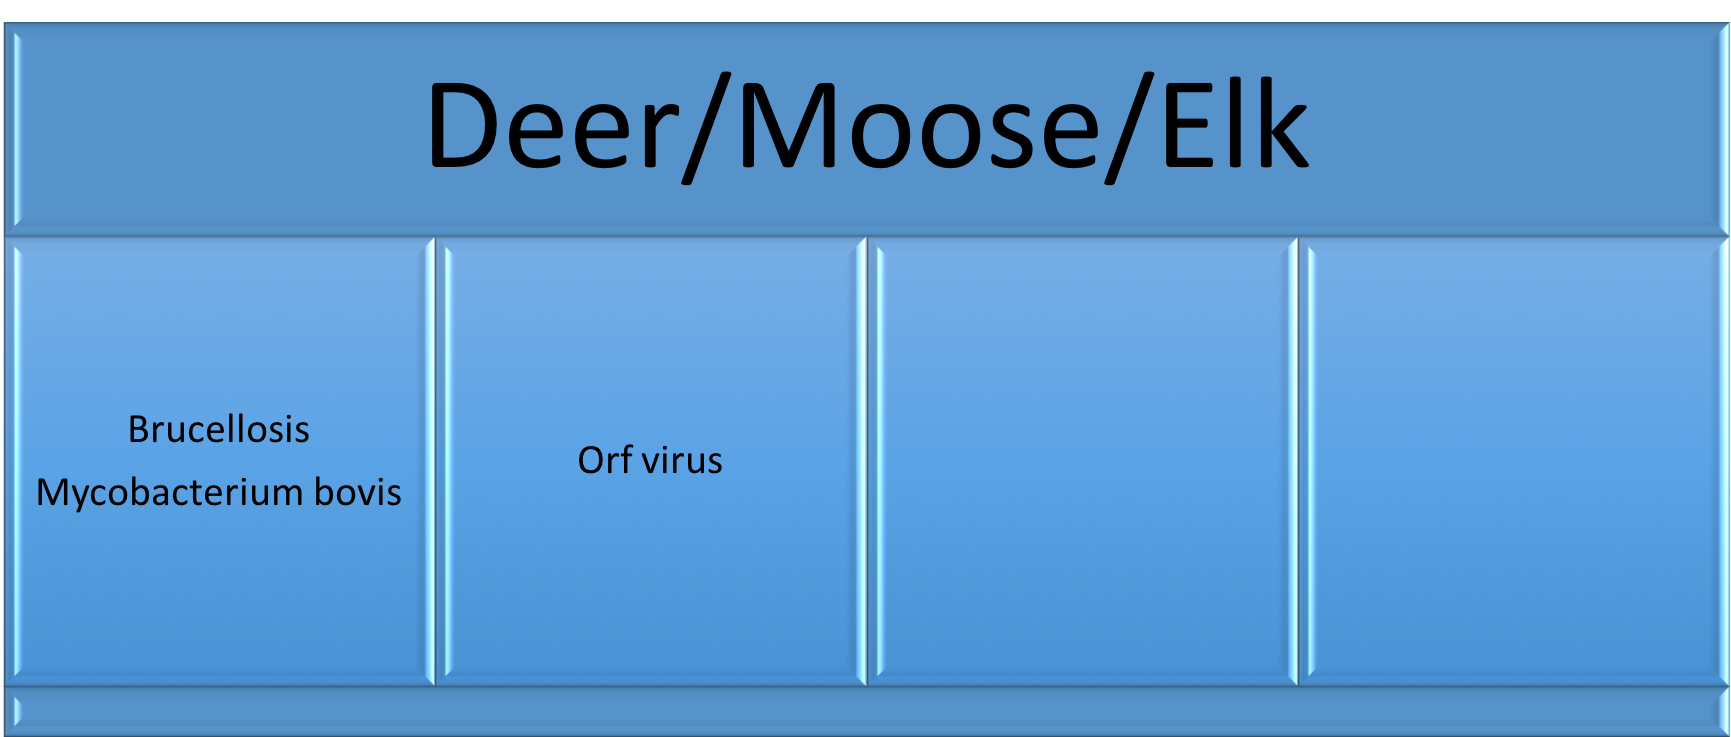


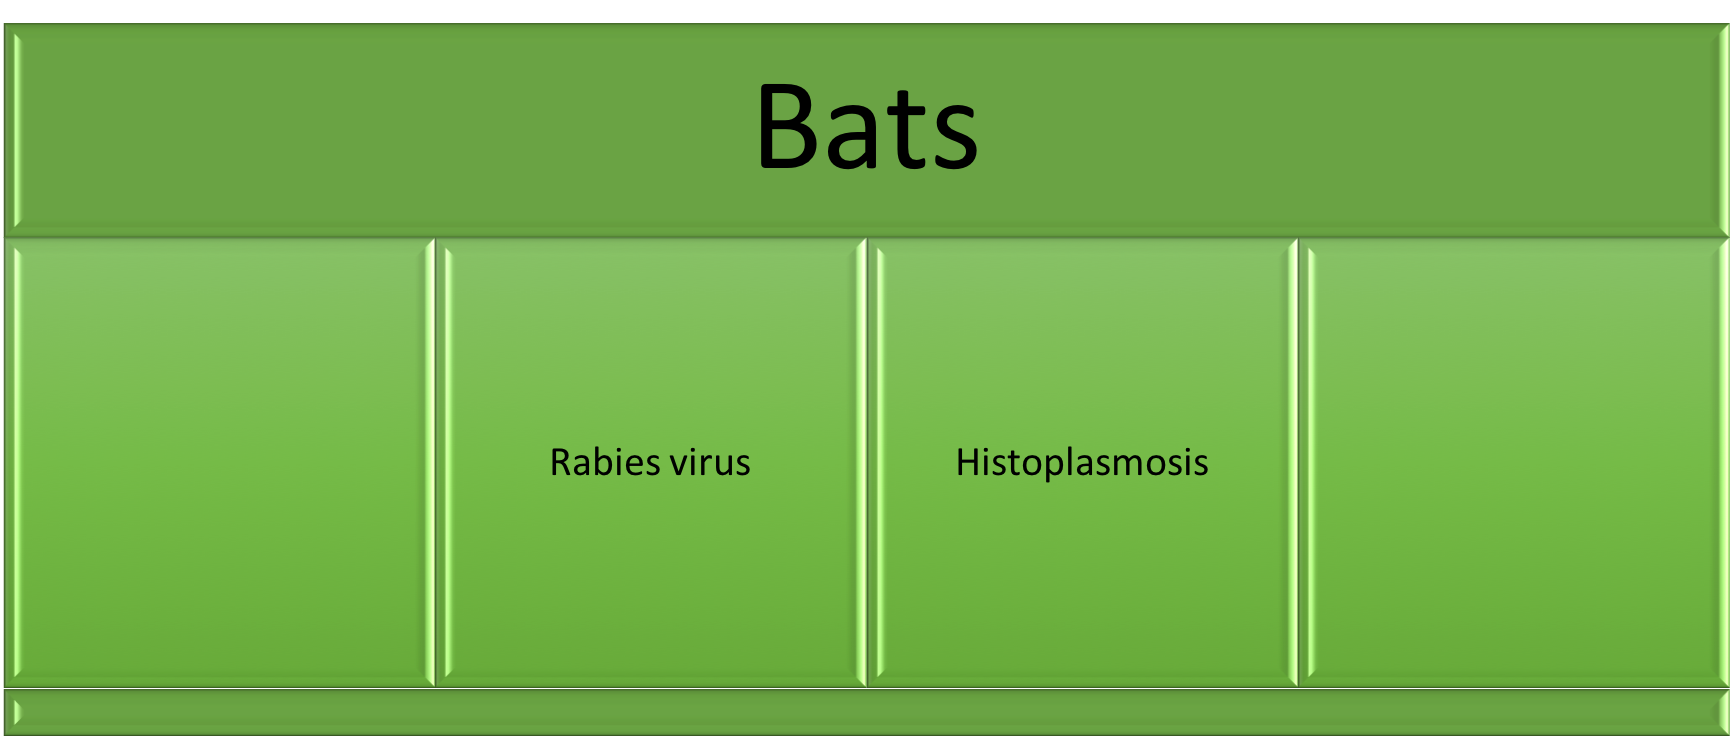
*This list does not include ALL pathogens. This is just a list of the most common plus others to think about in certain situations. In places outside of North America, this list may look
different.
**This is not intended to take the place of a formal infectious disease consult.
***Use this chart in the context of the clinical presentation. It does not mean you should test for all these infections in every patient, but rather gives you a quick reminder to consider them in your differential.
Was this helpful? Did I miss something? Tell me what you’re thinking with a comment!
1. Centers for Disease Control and Prevention. Healthy Pets Healthy People. http://www.cdc.gov/healthypets/pets/cats.html (Accessed on Feb 23, 2019).
2. Day MJ. Pet-Related Infections. Am Fam Physician. 2016; 94(10):794-802.
3. Goldstein EJC and Abrahamian FM. Diseases Transmitted by Cats. Microbiol Spectr. 2015; 3(5).
4. Chomel BB. Emerging and Re-emerging Zoonoses of Dogs and Cats. Animals (Basel). 2014; 4(3):434-445.
5. Dyer JL, Yager P, Orciari L et al. Rabies surveillance in the United States during 2013. J Am Vet Med Assoc. 2014; 245(10):1111-1123.
6. Boseret G, Losson B, Mainil JG, et al. Zoonoses in pet birds: review and perspectives. Vet Res. 2013; 44(1): 36.
7. Kwon-Chung KJ, Fraser JA, Doering TL, et al. Cryptococcus neoformans and Cryptococcus gattii, the Etiologic Agents of Cryptococcosis. Cold Spring Harb Perspect Med. 2014; 4(7):a019760.
8. National Association of State Public Health Veterinarians, Inc. (NASPHV), Centers for Disease Control and Prevention (CDC). Compendium of measures to prevent disease associated with animals in public settings, 2011: National Association of State Public Health Veterinarians, Inc. MMWR Recomm Rep 2011; 60:1.
9. Kotton CN. Zoonoses from pets other than dogs and cats. UpToDate. Published Jan 2019. Accessed on Feb 23, 2019.
Tuberculosis is the leading cause of death globally from an infectious agent. In 2017, an estimated 10 million people developed TB disease and an estimated 1.6 million died1. A recent study demonstrated that <57% of internal medicine housestaff across 7 academic institutions in the U.S. correctly answered 9 out of 10 questions assessing knowledge of assessment and diagnosis of tuberculosis2. This post addresses these questions and to helps clarify latent vs. active TB in a clinical setting.
The primary focus for this blog post is pulmonary TB. Be aware that although the most common presentation of TB is with pulmonary symptoms, TB can present anywhere in the body and sometimes can present without pulmonary symptoms.
But first, definitions.
Latent infection – the bacteria lies dormant in the body and does not cause any symptoms, typically tests for latent infection (see later section) will be positive
Active disease – the individual is experiencing symptoms due to the infection in the body, typically with characteristic imaging findings and microbiological confirmation
Primary disease – immediate onset of active disease after infection
Reactivation disease – onset of active disease after a period of latent infection
Extra-pulmonary disease – presence of bacteria outside of the lungs (the primary organ of infection)
Disseminated disease – two or more noncontiguous sites resulting from lymphohematogenous dissemination
Miliary disease – lesions in the lung that resemble millet seeds; seen in some cases of disseminated TB
Risk factors for TB exposure
*USPSTF gives a grade B recommendation for screening those at increased risk (see list above) for latent tuberculosis infection4
Risk factors for TB reactivation
A. Normal host
B. Age – immunity weakens in the elderly
C. Immunosuppression
The two syndromes are treated completely differently. Latent TB is non-infectious and does not require treatment to prevent progression of disease or transmission to others, but instead to prevent future reactivation. Active TB is infectious and needs to be treated to prevent spread of TB to others. The medications, doses and duration of therapy to treat these syndromes are also different from each other.
Active TB
A. Clinical symptoms
B. Imaging
Latent TB
(make diagnosis ONLY after you have excluded active TB)
A. Clinical symptoms
B. Imaging

*If there are any signs suggestive of active TB, then the patient should undergo active TB evaluation (discussed below). If there is no evidence of active TB, then treatment can be based on latent TB diagnostics (discussed below).
A. Active TB tests (pulmonary TB)
1. AFB smear – fluorochrome stain of the clinical specimen
2. AFB culture – the gold standard test for tuberculosis diagnosis
3. PCR = NAAT (nucleic acid amplification test) – this is a DNA test using amplification methods
B. Latent TB tests

1. Tuberculin Skin Test (TST) = Purified Protein Derivative (PPD)
Threshold for treatment

TB, tuberculosis; CXR, chest X-ray; HIV, human immunodeficiency virus; IBW, ideal body weight
*individuals who have received the BCG vaccine in the past may also test positive with this test since their immune systems have been exposed to TB via the vaccine (although immunity tends to wane within 10 years if vaccine is administered in infancy)
2. Interferon Gamma Release Assay (IGRA) = QuantiFERON-TB Gold or Plus OR T-SPOT.TB
*Indeterminate result DOES NOT mean it is in the middle between negative and positive. It means the test cannot provide a valid result.
*all latent diagnostic tests can cross-react in individuals infected with non-tuberculous mycobacteria (TST more so than the IGRA)
*Neither test is 100% sensitive and specific – if the patient has high pre-test probability for TB exposure and for future TB reactivation, ID physicians will sometimes treat for latent TB despite the negative tests
Treatment is complex and both choice of medication and duration depends on a variety of clinical and microbiological factors. Here is a basic overview of the difference in treatment between latent and active TB.
A. Latent TB (CDC)
*This is a useful calculator to determine the risks and benefits of TB reactivation vs. side effects from treatment in an individual patient.
a) Isoniazid – daily for 6 to 9 months
b) Rifampin – daily for 4 months
c) Rifapentine and isoniazid – weekly for 3 months
B. Active TB
— depends on susceptibility of bacteria and clinical syndrome
— RIPE therapy is the standard first-line therapy for fully-susceptible pulmonary TB infection with 2 months of all four drugs followed by 4 months of rifampin and isoniazid.
R = rifampin
I = isoniazid
P = pyrazinamide
E = ethambutol
*Ethambutol can be discontinued if drug susceptibility testing confirms a fully susceptible strain
*Patients with extensive disease e.g. cavitation or who remain smear and/or culture positive at 2 months may require a longer duration of therapy.
References:
1. Global Tuberculosis Report 2018: Executive Summary. World Health Organization. Published Sept 2018. Accessed Mar 10, 201
2. Chida N, Brown C, Mathad J, et al. Internal Medicine Residents’ Knowlesge and Practice of Pulmonary Tuberculosis Diagnosis. OFID. 2018; 5(7).
3. Tuberculosis (TB). Centers for Disease Control and Prevention. Available from: https://www.cdc.gov/tb. Accessed Feb 13, 2019.
4. US Preventive Services Task Force. Screening for Latent Tuberculosis Infection in Adults. US Preventive Services Task Force Recommendation Statement. JAMA. 2016; 316(9):962-969. doi:10.1001/jama.2016.11046
5. Lewinsohn DM, Leonard MK, LoBue PA, et al. Official American Thoracic Society/Infectious Disease Society of America/Centers for Disease Control and Prevention Clinical Practice Guidelines: Diagnosis of Tuberculosis in Adults and Children. Clin Infect Dis. 2017; 64(2):111-115. doi: 10.1093/cid/ciw778
6. Horsburgh CR. Priorities for the Treatment of Latent Tuberculosis Infection in the United States. N Engl J Med. 2004; 350:2060-2067. DOI: 10.1056/NEJMsa031667
7. Pai M, Behr MA, Dowdy D, et al. Primer: Tuberculosis. Nature Reviews. 2016; 2:1-23.
8. Mathew P, Yen-Hong K, Vazirani B, Eng RHK, and Weinstein MP. Are Three Sputum Acid-Fast Bacillus Smears Necessary for Discontinuing Tuberculosis Isolation? J Clin Microbiol. 2002; 40(9):3482-3484. doi: 10.1128/JCM.40.9.3482-3484.2002
9. Steingart KR, Schiller I, Horne DJ, Pai M, Boehme CC, and Dendukuri N. Xpert® MTB/RIF assay for pulmonary tuberculosis and rifampicin resistance in adults. Cochrane Database Syst Rev. 2014 Jan 21;(1):CD009593. doi: 10.1002/14651858.CD009593.pub3.
10. Zeka AN, Tasbakan S, and Cavusoglu C. Evaluation of the GeneXpert MTB/RIF Assay for Rapid Diagnosis of Tuberculosis and Detection of Rifampin Resistance in Pulmonary and Extrapulmonary Specimens. 2011; 49(12):4138-4141. doi:10.1128/JCM.05434-11.
11. Menzies D. Use of the tuberculin skin test for diagnosis of latent tuberculosis infection (tuberculosis screening) in adults. UpToDate. Available from: https://www.uptodate.com/contents/use-of-the-tuberculin-skin-test-for-diagnosis-of-latent-tuberculosis-infection-tuberculosis-screening-in-adults#H9. Accessed Feb 13, 2019.
12. QuantiFERON®-TB Gold Plus (QFT®-Plus) ELISA [Package Insert]. Hilden, Germany: Qiagen; 2016.
13. Comstock GW. Epidemiology of tuberculosis. Am Rev Respir Dis. 1982; 125(3 Pt 2):8.
This post is co-written with the guest writer Ahmed Abdul Azim, MD.
Not all fevers are caused by infections.
It is important that every patient presenting with fever is evaluated for an infection….. but what do you do when no infection is found?
If a patient is treated for a presumed infectious fever when they don’t have an infection:
Fever = 38.3°C (101°F) or above1
Pyrogenic agents = substances that can induce a fever.
a) Exogenous pyrogens – external substances that activate our immune system to induce a fever (ex. microbial toxins)
b) Endogenous pyrogens – cytokines that induce fever in our body
(ex. IL-1, IL-6, tumor necrosis factor, IFN-α, ciliary neutrotrophic factor, and likely others)
1. Rheumatologic/autoimmune – activation of immune system that stimulates the production of pyrogenic cytokines
– the cause of ~30% of fevers of unknown origin
a) Adult-onset Still’s disease – younger patients, daily fevers >39°C, rash, arthritis
b) Giant cell arteritis – older patients, vision changes, jaw claudication
c) Others – polyarteritis nodosa, Takayasu’s arteritis, granulomatosis with polyangiitis, etc.
2. Malignancy – tumor cells release pyrogenic cytokines
a) Lymphomas and leukemias – most common; seen in high burden of disease
b) Myelodysplastic syndromes
c) Renal cell carcinoma – ~20% of cases present with fevers
d) Hepatocellular carcinoma or liver metastases
e) Atrial myxomas
3. Drug-induced fever – 3-5% of drug-related adverse reaction in hospitalized patients include fevers6
– typically occurs 7-10 days after drug initiation, but can be as soon as 24 hours and as far away as a few years from drug initiation7
– patients typically appear “inappropriately” well
– eosinophilia (>500/mm3) occurs in 20-25% of patients with drug-induced fevers10
– PATHOPHYSIOLOGY:
a) Hypersensitivity reaction – due to activation of T cell immune response by drug, its metabolite, or the formation of an immune complex
– typically occurs ~3-10 days after drug exposure
– typically resolves 72-96 hours after discontinuation of drug (but can be more delayed)
– symptoms will recur immediately upon rechallenge
1) Antimicrobials – most common cause of drug fever
– minocycline, beta-lactams (penicillin-based > cephalosporins10), sulfonamides, nitrofurantoin
2) Anticonvulsants – carbamazepine, phenytoin, phenobarbital
3) Allopurinol
4) Others
– DRESS syndrome – a severe type of drug hypersensitivity reaction
(typically occurs 2-6 weeks after drug exposure)
b) Administration-related – typically last <48 hours
1) Vaccines – stimulation of the immune system → release of pyrogenic cytokines
2) Amphotericin B – exogenous pyrogenic agents
c) Pharmacologic action of the drug – transient fever; self-resolving
1) Anti-neoplastic agents – cause severe and rapid tumor cell lysis → release of endogenous pyrogenic agents → inflammatory response (fever)
2) Antimicrobials – cause rapid death of microbes → microbial cell lysis → release of exogenous pyrogenic substances → inflammatory response (fever)
– ex. Jarisch-Herxeimer reaction in syphilis treatment with penicillin
d) Altered thermoregulation – disturbance of the central hypothalamic thermoregulation function and/or increased heat production
1) Exogenous thyroid hormone
2) Anticholinergic drugs
3) Sympathomimetic agents

e) Idiosyncratic drug reactions
1) Serotonin syndromes – linezolid, SSRIs
2) Neuroleptic malignant syndrome
– anti-psychotics, dopamine antagonists
3) Malignant hyperthermia syndrome
– inhaled anaesthetics, paralytic agents
4) G-6-PD deficiency – dapsone, primaquine, nitrofurantoin, etc.
4. Other causes
1) Transfusion of blood cells – RBCs, platelets, WBCs
2) Central fevers – fevers due to central thermodysregulation due to CNS damage
– more common with CNS hemorrhage and brain tumors11
– fever onset within 72 hours of sustaining CNS hemorrhage
3) Thromboembolism – typically <102°F
4) Endocrine – thyroid storm; adrenal insufficiency
5) Pulmonary – ARDS, aspiration pneumonitis, cryptogenic organizing pneumonia
6) Intra-abdominal – acute pancreatitis, cholecystitis, mesenteric ischemia
*Non-infectious causes of fevers are diagnoses of exclusion. A patient MUST have an appropriate workup for infectious causes prior to considering any of the non-infectious causes of fever.
*A lot of these diagnoses need to be made based on clinical symptoms and signs and requires a high degree of suspicion.
*Fever is a sign of an underlying inflammatory process.
DO NOT TREAT THE FEVER — TREAT THE UNDERLYING CAUSE.
References:
